















Table of contents



In the U.S., 63% of adults say thinking about their personal finances makes them anxious, up from 56% in 2021, according to the FINRA Foundation's 2024 National Financial Capability Study. For younger adults aged 18 to 34, that figure reaches 75%. That anxiety shapes consumer behavior towards financial services, and it weighs most on the emerging generations.
Two customers can look identical on paper, yet one opens a message, books an appointment, or moves money while the other does nothing.The financial services industry has plenty of data on what customers do, but far less on why they do it. Digital experiences, price pressure, and AI tools have changed the "what" quickly, while core motivations are still rarely measured and leveraged.
Below, we’ll cover six shifts in consumer financial behavior, the motivations that transaction data cannot show, and a worked example using Psympl's own research with Ipsos.
What Influences Consumer Decisions About Financial Services?

In the financial sphere, there are two primary drivers of decision making for customers, according to academic work on consumer behavior in financial services, including the Foundations and Trends review of consumer financial behavior. These drivers are:
1. Attitudes toward risk, debt, advice, and institutions
2. Decision-making style: deliberate or habitual, self-directed or advice-seeking
External forces such as deregulation, technology, and economic conditions sit on top of both. Attitudes also cut across demographics. Western & Southern's 2020 segmentation study found six financial styles, from Prideful Explorers (25%) to Joyful Spenders (9%), and concluded that age and income do not explain them.
The three pillars of customer insight are sentiment, their opinion on your service; behavior, their real-world actions; and their motivation, the “why” behind their behavior and sentiment. Most institutions can measure sentiment (through surveys and NPS) and behavior (through transaction data). Motivation, the reason a customer wants a particular outcome, is the least-measured driver of the three. That gap is where most targeting errors start, since two similar-looking customers are responding differently to the same offer.
6 Changes in Consumer Behavior Driven by Digital Experiences, the Economy, & AI

Six shifts stand out from recent consumer surveys we’ve curated. Each one raises what customers expect from a financial institution.
1. Mobile-First Banking and Instant Payments Set the Speed Standard
In 2023, 48.3% of banked U.S. households used mobile banking as their primary way to access an account, according to the FDIC's household survey. Credit card disputes, wealth account openings, and advisor scheduling now get judged against that same phone-speed standard.
2. Personalization Expectations Vary by Customer
A 2021 Diebold Nixdorf and NielsenIQ study found that 82% of U.S. "Empowered Self-Starters" would share more personal information in exchange for more personalized service. Western & Southern's 2020 study found that 93% of Thoughtful Planners rate safeguarding their information a 9 or 10 out of 10, so the right level of personalization differs by customer.
3. AI Tools Enter Everyday Money Management
Per the FINRA Foundation, 20% of U.S. adults are interested in AI financial advice, including 30% of adults aged 18 to 34 and 8% of those 55 and older. Drive Research found that 62% of banking consumers have not tried AI tools, but 70% of those who have are satisfied with the results.
4. Trust Still Leans on Human Guidance
Drive Research found that 68% of banking consumers call phone support essential, while only 4% prefer it as their main way to bank. Half rely on friends and family for financial advice, and Gen Z turns to social media (44%) more than to bank representatives (39%).
5. Financial Relationships Spread Across More Providers
Accenture's 2022 global study found consumers hold 6.3 financial products on average, with only about half at their main bank. Fintech apps widen the spread, since 49.7% of U.S. households used nonbank payment services in 2023 (FDIC), and 58% of Millennials and 57% of Gen Z say they would switch for a better fit (Drive Research).
6. Emotional Triggers Shift With the Economy
The Federal Reserve's 2025 SHED report found that 77% of U.S. adults changed their behavior in response to higher prices, and 41% reduced their saving. FINRA reports that 26% of adults now spend more than they earn, an all-time high for the study.
Deciphering Consumer Behavior: How Psychographics Read the Motivation Behind Every Click
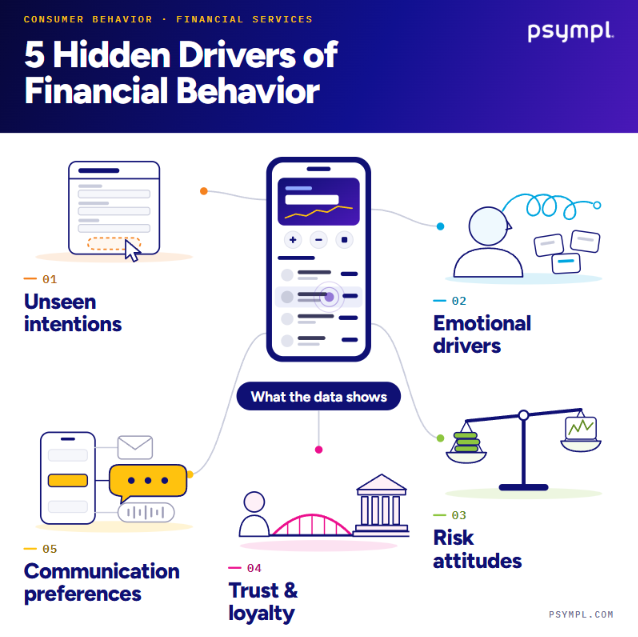
If you want to access the final pillar of customer decision making, psychographics unlock the consumer motivations behind behavioral data by deciphering attitudes, values, concerns, and priorities behind each action. Accessing this layer provides the most accurate insights into your customers. For a deeper read, our article on financial psychographics covers the method in more depth.
1. Reasons Behind the Actions Transactions Record
A transaction log shows a skipped credit application as nothing at all. The CFPB found that 27% of consumers decided not to apply for credit in the past year because they expected to be turned down.
2. Emotional Drivers Behind Financial Decisions
In the UK, 22% of adults feel overwhelmed and stressed when dealing with financial matters, and 92% of adults with low financial capability say it affects how they deal with financial firms, per the FCA's Financial Lives 2024 survey. Overwhelm shows up as delayed decisions and avoided calls.
3. Risk Attitudes Beneath the Account Balance
Only 16% of U.S. adults say they are willing to take investment risks, down from 20% in 2021 (FINRA). In the UK, 61% of adults with £10,000 or more in investible assets hold most of it in cash, and 34% of non-investing cash savers cite fear of losing money (FCA).
However, Psympl’s research has identified psychographic mindsets that are willing to bear significantly more risk, even in a turbulent market. A key to financial services’ success is identifying whom to engage with riskier opportunities while respecting others’ caution.
4. Trust Triggers That Shape Loyalty
The FCA found 48% of UK adults have high trust in their own account provider, but only 21% have high trust in banks generally. In the U.S., 62% of adults trust banks to treat them fairly, with lower trust among adults aged 18 to 34 (59%) than among those 55 and older (68%).
5. Preferred Channel, Cadence, and Tone
Drive Research's four banking segments differ in technology use: 63% of Innovative Investors have used AI for banking tasks, compared with 15% of Conventional Consumers. Segment-level preferences for channel, send frequency, and tone can change whether the same offer gets read or ignored.
1 Offer, 2 Mindsets: How Psychographics Works in Practice
In Psympl’s study with Ipsos of 3,000 U.S. adults, two of the five segments report nearly identical average household income (about $122,000) and net investable assets (about $1.1 million). They differ on advice: 77% of one say they trust professional financial advisors to handle their money, versus 44% of the other.
Send both the same offer, a higher-yield account for idle cash. The first group’s message leads with protection and predictability and promises periodic updates; the second group’s message leads with the rate, the math, and progress toward a goal they define (illustrative messaging). A transaction log and a satisfaction score would treat the two customers alike, which is the gap motivation fills.
To test it, hold out a comparison group that receives your standard message, then compare response rate, application completion, and funded balances by segment.
Psympl's Psychographic Tech Stack: 6 Tools Financial Institutions Use to Act on Motivation
Our psychographic segmentation platform is built around six key tools, each of which provides a different benefit to financial institutions, allowing them to classify customers by motivation and build campaigns around each segment.
|
Tool |
Workflow Stage |
What It Does |
Best For |
|
Classify (individually) |
Short psychographic survey that assigns a person to a segment in under two minutes (with Psympl® reporting 90% predictability) |
Institutions that want to identify individual customers or prospects directly, even without behavioral history |
|
|
Classify (at scale) |
Uses an Experian® data-based lookalike model to assign segments across a customer or prospect list, with no survey required |
Institutions that need to segment a full CRM or prospect file without asking every customer to respond |
|
|
Plan |
Stores the research behind each segment, including financial attitudes, communication preferences, and behavioral triggers, with geotargeting and heatmapping |
Marketing and strategy teams planning campaigns, branch strategy, and market coverage |
|
|
Create |
Generates segment-aligned content such as emails, text messages, call scripts, and marketing copy |
Teams that need to produce and test segment-specific messaging without writing every variation by hand |
|
|
Refine |
Evaluates existing website or campaign copy through a psychographic lens and rewrites it to match a segment |
Teams with content already in market that want to sharpen it rather than start over |
|
|
Engage |
Attaches psychographic context to individual contact records |
Advisors, relationship managers, and frontline staff preparing for a conversation |
Want to See How Your Customers Really Make Financial Decisions?
Purchases, page views, and log-ins show what customers did. They cannot show which message would have moved a customer who did nothing.
Psympl adds a motivation segment to each customer or prospect record, using either the Motivation Auto-Decoder™ (built on Experian® data) or the Motivation Decoder™ survey. Contact us to walk through what that looks like for your existing customers.
6 Guardrails for AI Personalization & Protecting Consumer Trust in Banking
AI-driven personalization only works when customers understand and the institution can defend how it was built. The six guardrails below address the trust and compliance risks that come with AI customer segmentation in banking.
|
Guardrail |
Benefit |
Risk of Ignoring |
|
Be Transparent About How Data Informs Personalization |
Builds the customer trust that makes personalized messaging feel helpful instead of intrusive |
Customers who feel watched may disengage, opt out, or lose confidence in the institution |
|
Test Segments for Disparate Impact |
Catches outcomes that unintentionally disadvantage protected groups before they reach customers, and creates documentation for regulatory review |
Fair lending exposure and reputational damage if a segmentation model produces skewed outcomes that no one checked |
|
Keep Humans in the Loop for Major Decisions |
Matches how customers want to be served, since many still prefer a knowledgeable person for high-stakes financial choices |
Automation that oversteps can erode trust at the moments when advice matters most |
|
Separate Marketing Use From Credit Decisions |
Keeps psychographic insight in a lower-risk lane (messaging, tone, channel) and out of underwriting, with audience criteria still reviewed for fair lending |
Blurring the two can pull a marketing model into credit-related regulatory requirements it was never built to meet |
|
Limit Data Collection to What the Goal Requires |
Reduces the volume of sensitive data to secure, govern, and explain |
More data means more breach exposure, more privacy obligations, and a harder story to tell customers |
|
Review Every Message Against Compliance Standards |
Keeps AI-generated content within regulatory and brand standards, including review for unfair or deceptive claims,before it ships |
Non-compliant or misleading messaging can reach customers at scale, faster than a manual process would have caught it |
8 Steps to Turn Consumer Motivation & Behavior Insights Into Campaigns Your Customers Respond To

A psychographic program works best when it starts small and ties every step to a result you can measure. To properly align your psychographic strategy, we recommend these eight steps:
1. Set One Measurable Business Goal
Pick a single outcome, such as new high-yield savings accounts opened in 90 days. Record today's number for that outcome first, so a goal with a baseline and a deadline can show later whether the segments helped.
2. Take Inventory of Your Existing Customer Data
List what your CRM, core system, and marketing platform already hold, and note the gaps. Many institutions find they have plenty of transaction data and almost nothing on attitudes.
3. Layer Psychographic Segments/Motivation Intelligence Onto Existing Records
Assign segments to your records with the Motivation Auto-Decoder™ for a full list or the Motivation Decoder™ for individual customers. Our guide to bank customer segmentation explains how segmentation and psychographics fit together.
4. Choose a Single Campaign for a Pilot
Start with one offer, as FreeStar Financial Credit Union did with a 4% High Yield Savings account. Send it to a small set of psychographic segments (FreeStar used three) and hold out a comparison group that gets your standard message, as FreeStar Financial did with its traditional control group.
5. Map Message, Channel, and Cadence for Each Segment
Use the Consumer Console™ to pull each segment's communication preferences and behavioral triggers. Then decide which message, channel, and send frequency each segment gets.
6. Build and Test Segment-Specific Content Against the Guardrails Before Scaling
Draft variations with Psymplifier™ and run them through your compliance review. Check each version for disparate impact and data-use transparency before it goes to customers.
7. Train Frontline Teams to Use Segment Insights
Give advisors, branch staff, and call center teams a short guide to each segment's tone and concerns. The Sales Extension puts that context on the contact record before the conversation starts.
8. Measure Results and Refine
Compare response, conversion, and opt-out rates by segment against your original goal. Retire what underperformed and rewrite it with the Psymplifier™ Extension.
8 Insights Into Consumer Behavior & Psychographics in Banking
Matching your strategies to your customers’ motivation is a lucrative process, but retaining trust throughout is vital to the success of the entire project. Before you get started on the road to psychographic segmentation, here are the questions that can clear up the path from the get-go:
1. Can Psychographics Work for B2B Financial Marketing?
Partly: business buyers have their own attitudes toward risk and advice, but the method does not scale the way it does for consumers. The Motivation Auto-Decoder™ matches consumer records using name and home address, and national data compilers such as
Experian does not typically track people by work address, so one B2B route is the Motivation Decoder™ survey, which works one person at a time and may not be feasible at volume. If there is a high probability that employees of a business live in relatively close proximity to their place of work, the Motivation Auto-Decoder™ may identify employees’ psychographic mindsets using Psympl’s geo-targeting and prospect list generation capabilities.
2. Do Psychographic Profiles Change Over Time?
Core motivations tend to hold steady, but attitudes can shift with life events and the economy. FINRA found willingness to take investment risks fell from 20% to 16% between 2021 and 2024, so refresh segment assignments periodically and retest messaging.
3. Does Psychographic Data Replace a CRM?
No. Your CRM records what happened, and psychographic segments add a field that explains why. The Motivation Auto-Decoder™ assigns segments across an existing CRM list.
4. Can Smaller Banks and Credit Unions Use Psychographics?
Yes. The Auto-Decoder works from an Experian® data-based lookalike model with no customer survey, and the Motivation Decoder™ classifies people even without behavioral history. A single-campaign pilot keeps the effort and cost contained.
5. Does Psychographic Segmentation Apply to Insurance and Wealth Management?
It does. Western & Southern, an insurer, built a six-segment attitudinal study that includes Advice Seekers (17%) and Enthusiastic Investors (12%). Advisors can use segment context on contact records to adjust how they open a conversation. The Psympl psychographic model was developed with wealth management, in addition to banking, in mind.
6. How Are Psychographic Segments Different From Customer Personas?
Personas are written profiles built from a team's judgment about typical customers. Psychographic segments are assigned to real customer and prospect records based on measured motivation, so you can target them directly.
7. How Do Psychographics Relate to Behavioral Finance Biases?
Biases such as overconfidence and loss aversion describe how people deviate from rational choices. FINRA's finding that 64% rate their knowledge highly while only 32% of them pass a basic compound-interest question is one example. Psychographics measures attitudes such as risk tolerance and trust, which can inform how a message is framed for someone prone to a given bias.
8. How Soon Can Institutions Expect Results?
FreeStar Financial's first campaign reported $1.2 million in new deposits within 30 days from a limited test audience of 10,000 prospects. Outcomes such as account balances depend on your product and sales cycle, so set the measurement window before launch.
Put Customer Experience Insight to Work: Let's Look at Your Segments Together

Consumer behavior in financial services is shifting on all fronts. Every year, customer desires on speed, personalization, AI, trust, and provider loyalty continue to evolve. The only constant is the customer.
The institutions that keep up are the ones that understand why the customers make their decisions, not the ones that just track what decisions are made. Psychographic segments give your marketing, product, and frontline teams a shared way to see that.
Psympl can map your customer or prospect file to motivation-based segments and show where your current messaging fits or misses. We can also help you scope a single pilot campaign with clear goals and guardrails. Reach out now to see what insights we’ll uncover in your own data.

Brent N Walker
Table of contents